Features
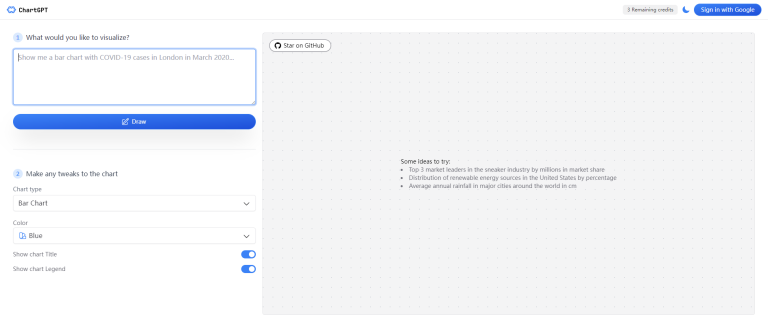
- Simple Conversion Process: Transform text data into engaging charts with utmost ease, requiring just a few clicks to achieve compelling visualizations.
- Customizable Visualizations: Tailor the appearance and style of your charts to align with your preferences or brand identity, adding a personalized touch to your visual content.
Use Cases:
- Data Analysis and Reporting: Efficiently analyze and present data through visually appealing charts, ensuring accurate insights for informed decision-making.
- Presentations and Infographics: Elevate your presentations and infographics by converting textual information into eye-catching visualizations, capturing and retaining audience attention.
Unleash the potential of your text content by effortlessly transforming it into stunning charts. Elevate your data analysis, reporting, presentations, and more with ChartGPT!

