Features
- User-Friendly Interface: Graphy boasts a simple and straightforward interface, ensuring ease of use for both beginners and seasoned users alike.
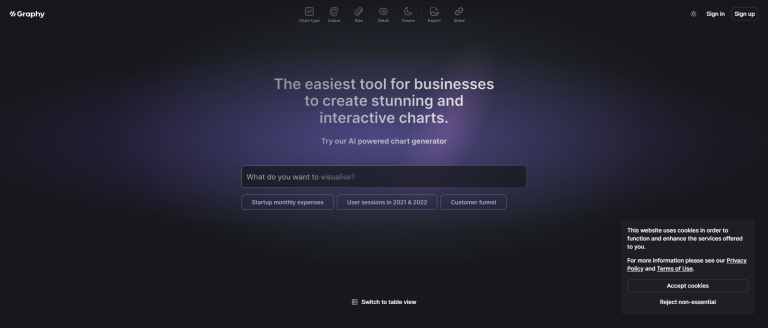
- AI-Powered Chart Generator: Leverage the smart and automated chart creation tool, driven by AI, enabling the effortless generation of compelling data visualizations with just a click.
- Wide Range of Chart Options: Whether it’s expenses, user sessions, customer funnels, or any other business data, Graphy offers a plethora of chart types for optimal data representation.
- Convenient Embedding Option: Effortlessly embed your charts into Notion or other platforms, facilitating simple sharing and collaborative analysis.
Use Cases:
- Business Expense Tracking: Utilize Graphy to create easily understandable charts showcasing your startup’s monthly expenses over specific periods.
- User Session Analysis: Visually represent and analyze user session data from 2021 and 2022, gaining deeper insights into your user engagement.
- Customer Funnel Visualization: Craft an interactive customer funnel chart for a detailed understanding of your customers’ journey.
With its blend of simplicity, advanced AI technology, and versatile features, Graphy emerges as the go-to tool for businesses addressing their diverse data visualization needs.

